Kaggle challenge | Airbnb New User Bookings

Airbnb is an online marketplace that enables people to lease or rent short-term lodging. The goal of this Kaggle challenge was to predict which country a new Airbnb user’s first booking destination will be based on a set of demographics and web session records. Additionally, I used model-based analysis to understand which factors are most predictive about whether a new user would book a destination.
Data Overview
The training data set consists of user information collected from 6/28/2010 - 6/30/2014 with the booking destination (target variable) provided (213,451 users). The goal of the challenge is to predict the booking destination for a test data set collected from 7/1/2014 - 9/30/2014 (62,096 users).

Figure 1. Example user data.
An additional data set provides web sessions records that can be linked to the user information tables via a user id. Each record includes an action that was taken defined by the action name, type, and detail. The number of seconds spent on the action are also provided.

Figure 2. Example web sessions records.
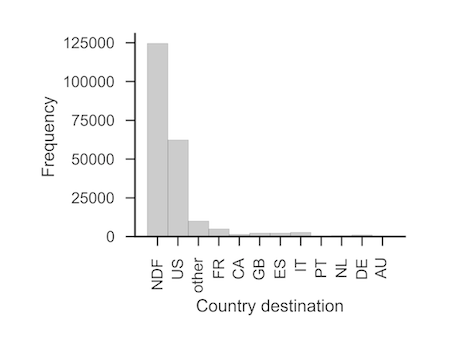
The target variable consisted of 12 possible country destinations. The classes are highly unbalanced. Non-bookings (NDF) and United States bookings (US) vastly outnumber all other classes (58% and 29% of the data set, respectively). Many demographic features are also heavily unbalanced and contain missing values or other unusal observations.

Figure 3. Distribution of first user bookings by country destination.
Data Preparation
I formatted and cleaned the user information to be suitable for modeling. I checked the distributions of all user features. Dates were formatted into years, months, days, and weeks of the year. Ages that were likely to be errors (<14 or >100) were recoded into missing values. Missing values were not imputed, but were coded as zero and a new feature was added to indicate missing values. One-hot-feature encoding was used to generate features for all categorical variables. All features were rescaled between zero and one so that features with higher magnitudes did not dominate the objective functions for certain algorithms.
For the web sessions data, I encoded each unique combination of action name, type, and detail as a separate feature. These were binary variables to indicate whether or not the user took a particular action at any time. I also explored versions that considered the number of times a user took each action and the total time spent on each action, but found no increase in model performance. In total, the models used 346 features.
Predicting Whether a New User Will Book.
To understand the data, I first trained a linear model for binary classification of users that booked or did not book any desintation. I used L1-regularized logistic regression because it can be trained reasonably fast, provides interpretable coefficients about feature importance, and establishes a baseline linear model against which more complex algorithms can be compared. The regularization term penalizes the model for higher coefficient values to prevent overfitting and returns sparse coefficient vectors that can inform feature selection. The regularization term was selected using 5-fold cross validation over a range of values.
To validate the models, I held out the last 10% of the training data set collected chronologically (21,345 users). This followed the test data format and ensured that predction accuracy was not inflated by using future data to predict past obsrevations. The remaining 90% of the data was used for training. Because the data are unbalanced, I used area under the ROC (auROC) curve for the holdout set to as an error metric to compare models.
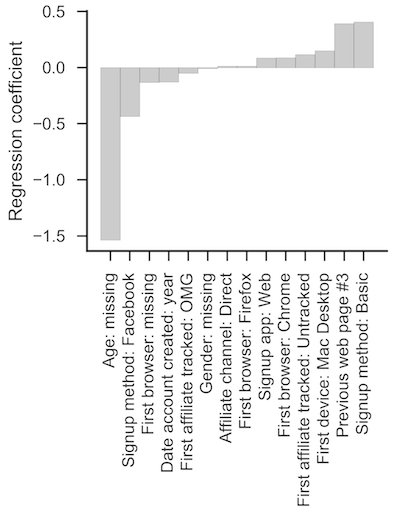
The logistic regression model accurately predicted whether or not a user would book a destination for 71.4% of the holdout dataset, which exceeds chance (62% in the holdout set), and resulted in auROC of 0.75. The resulting coefficients provide insight about which users will book a destination. For example, users who reach Airbnb via a particular web page (actual URL concealed) are more likely to book. Conversely, disengaged users that failed to provide demographic information like gender and age were less likely to book.

Figure 4. Non-zero regression coefficients used to predict users who did or did not book with Airbnb identified with L1-regularized logistic regression. Positive coefficients indicate a positive relationship with probability of booking.
Predicting Booking Destinations:
I evaluated three algorithms for the multiclass classification problem of predicting the actual country destination of that the users booked. For model comparison, I used macro-averaged auROC which combines auROC for each class with equal weight regardless of the number of observations. I used confusion matrices to determine where the models were succeeding and failing. I also monitored the normalized discounted cumulative gain (NDCG) score, the ranking quality metric used by Kaggle to evaluate submissions. Typically, a bootstrap could be used to assess the statistical significance of differences in error metrics, but in the interest of time I simply gauged performance on the holdout and test set.
L1-Regularized Logistic Regression
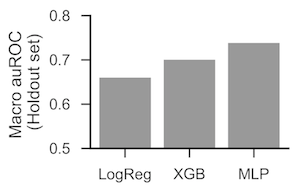
I started with a one-versus-next L1-regularized logistic regression approach implemented in scikit-learn. The model trains a family of linear classifiers to distinguish one class from all others and predicts the class with the highest probability. The linear model performs above chance as indicated by a macro auROC of 0.66. The confusion matrix indicates that the model is heavily biased to the non-booking (NDF) and US categories.

Figure 5. Confusion matrices for each of the three models. Shading indicates the predicted probability of each country destination (x-axis) by actual destination (y-axis). Correct responses are on the diagnoal from upper left to lower right. The models generally overpredict the NDF (non-bookings) and US (United States) classes due to the imbalanced data. The multilayer perceptron achieves best performance primarily by better distinguishing the non-bookings class (note higher contrast), but all models struggle to discriminate bookings in non-US countries.
Boosted Trees: XGBoost
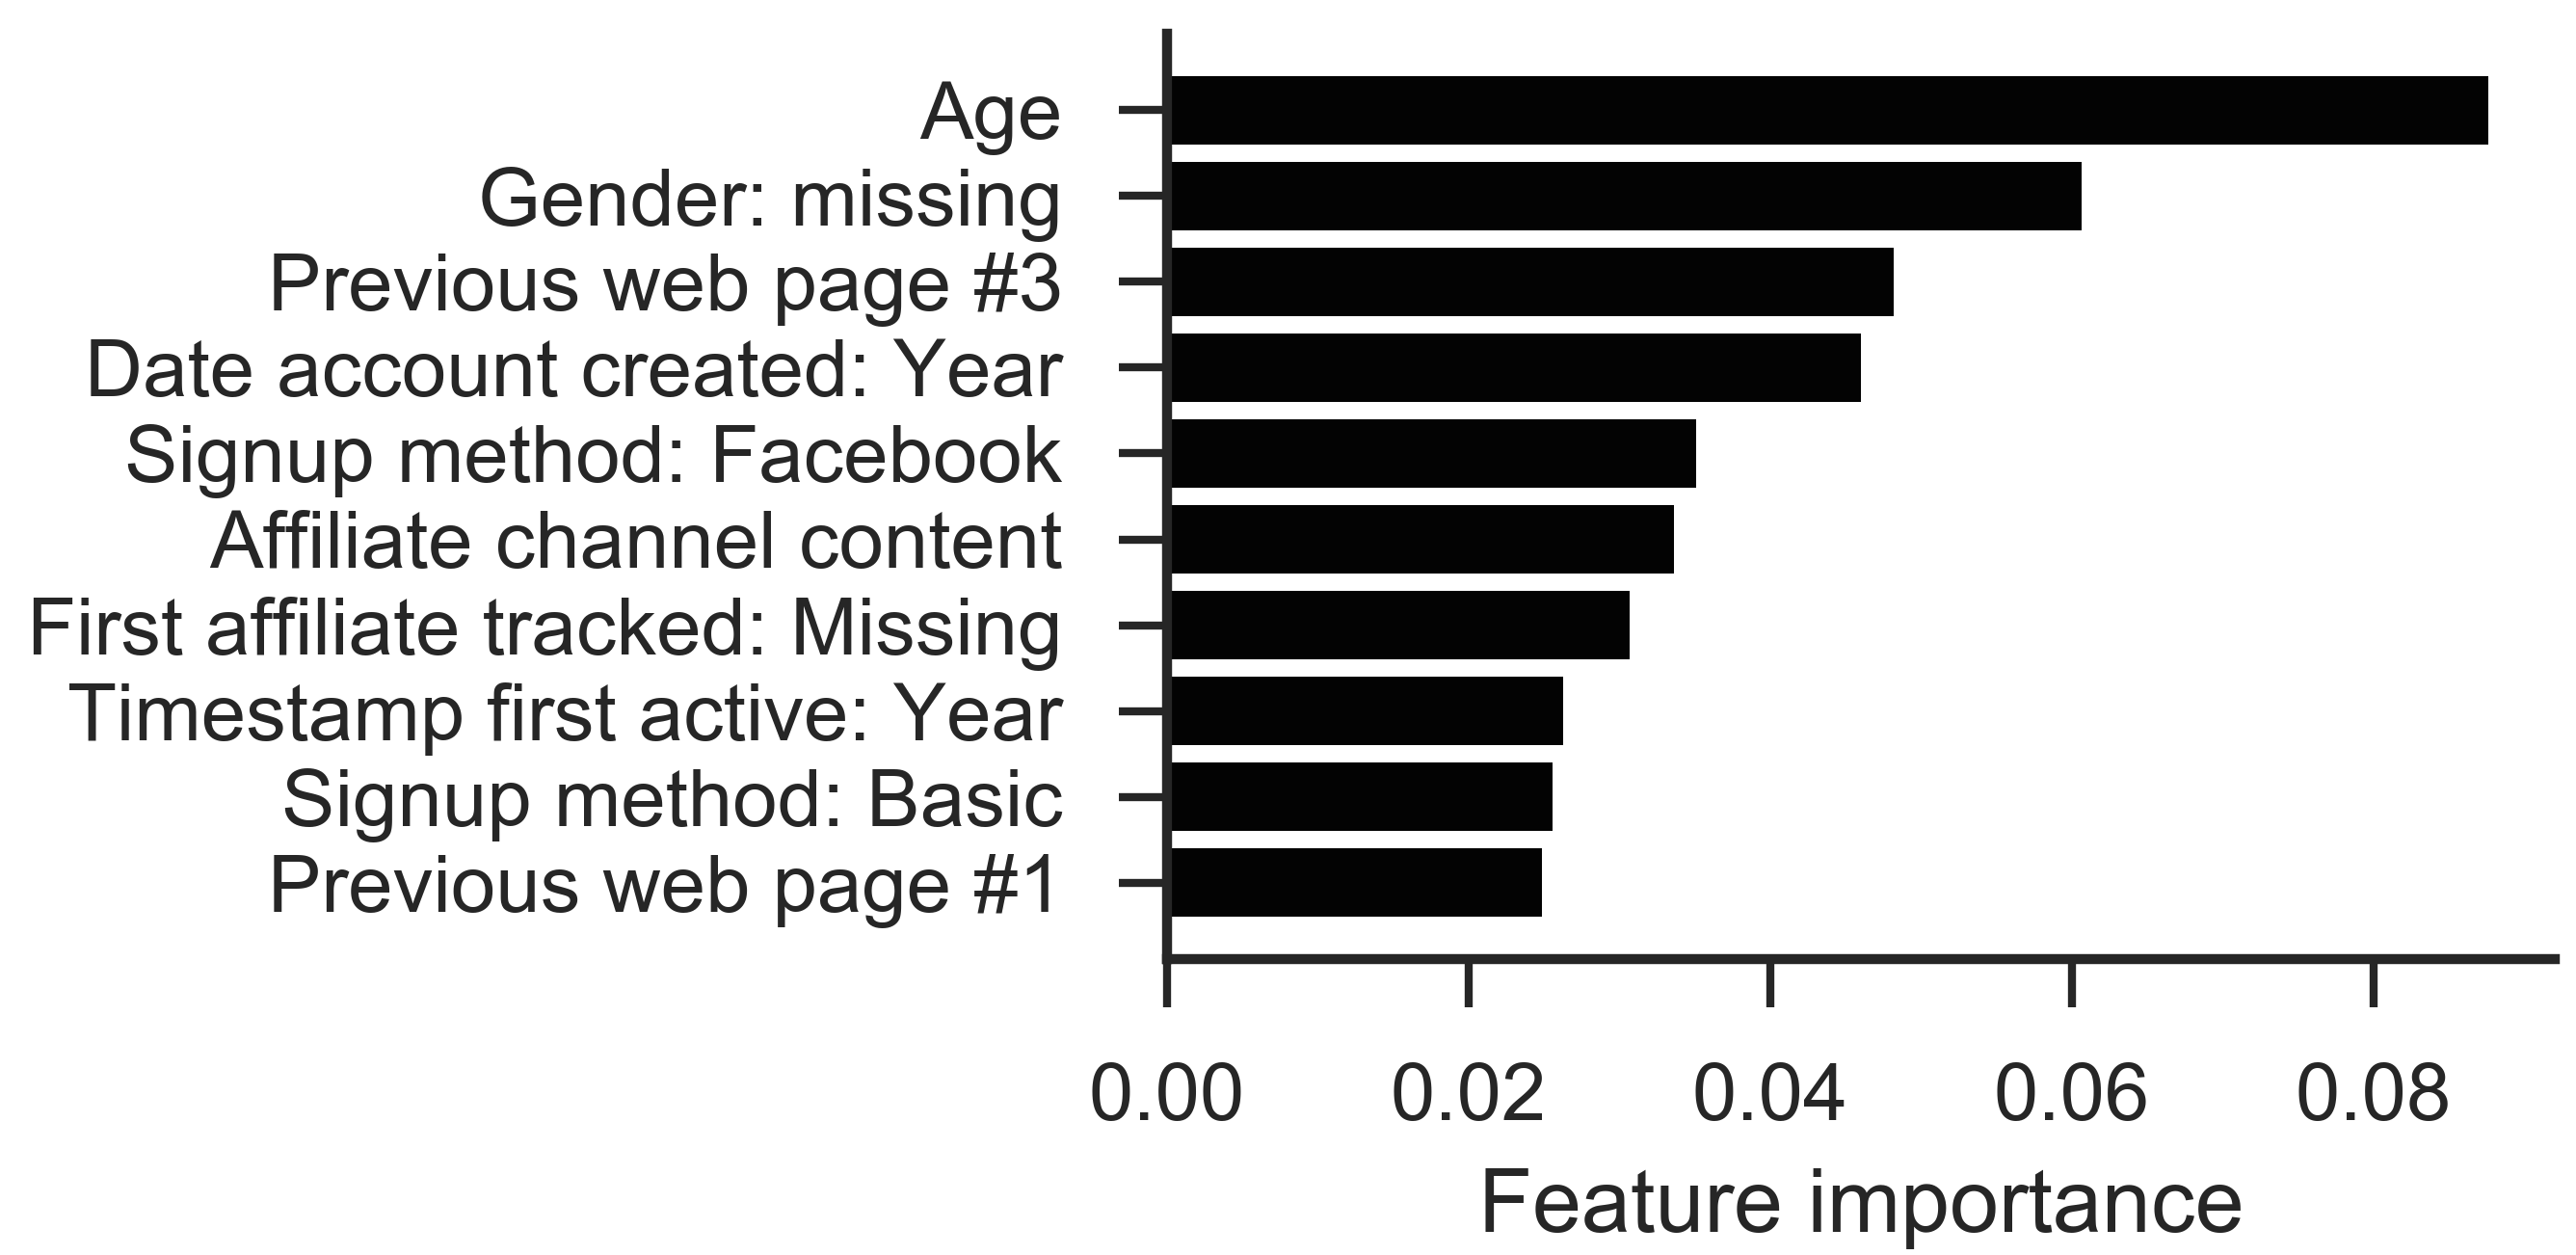
XGBoost is a tree ensembling method that learns a set of decision trees by asking whether new tree structures will adequately improve a regularized objective function. Unlike logistic regression, XGBoost learns nonlinear decision bounds and may better handle unbalanced classes. One tradeoff is that the model requires more hyperparameters (e.g., number of trees, learning rate, etc), which I selected using randomized search with 5-fold cross validation. The resulting model produced a notable improvement in auROC for the holdout dataset (0.70). XGBoost also provides an index of feature importance, computed as the reduction in impurity at each node averaged over all trees for each feature. Unlike the linear model, XGBoost learned a nonlinear relationship between age and booking that was evident in the data.

Figure 6. Feature importance ratings obtained from XGBoost. Larger values indicate that a feature promoted greater reductions in impurity.
Artificial Neural Network: Multi-Layer Perceptron
Multi-layer perceptrons (MLP) are a class of feedforward neural network models that learns combinations of features to transform the data into a space where they become lineary separable. These models are very powerful, but highly parameterized and require careful training for good results. I trained the model using mini-batch stochastic gradient descent implemented in Keras with a TensorFlow backend. To efficiently select hyperparameters, I implemented a randomized search with 5-fold cross validation in parallel on a high-performance computing cluster. The trained network outperformed both logistic regression and boosted trees on the holdout set (auROC = 0.74). This algorithm would be a great choice for situations in which high accuracy is paramount, but long training times are not an issue.

Figure 7. Macro-averaged area under the ROC curve for the three algorithms using the holdout data set (21,345 users). The macro-average gives equal weight to classes regardless of the number of observations so that the NDF category does not dominate the statistic. Values greater than 0.5 indicate above chance discrimination (1.0 = perfect discrimination). The same ordering of performance was confirmed using the full test set evaluated by Kaggle (62,096 users).
Conclusions
I used a variety of machine-learning approaches to predict where users will book their next destination on Airbnb and to learn the features that are most predictive. The final model provided ranked predictions about where a new user would book that could be used to prioritize listings shown to users. Feature selection tools revealed that age, previously visited web sites, and user devices are informative factors in whether a user will book. These results could inform decisions about where to advertise for new users or to evaluate ongoing advertising campaign.
For this data set, the XGB and MLP outperformed the linear model. The XGB model was particularly impressive since the time necessary for fitting was quite fast. The MLP model provided the best performance, but took considerably longer to train. The long training times were greatly reduced by parallelization on a computing cluster (<5 hours total, up to 300 samples in parallel), making this an attractive option if a cluster is available.
Using the MLP model, my final NDSG score on the Kaggle private leaderboard was 0.88209 - close to the winning score of 0.88697 (range = 0 to 1). The top models in this competition stacked and ensembled up to 15 models (see interviews with the 2nd and 3rd place finishers), which could have been a fruitful but time-consuming avenue to explore. Complex stacking of many models can be impractical in many business applications, but it may be useful for cases in which small gains in accuracy translate to substantial real-world gains.